As part of a SAP HANA deployment, there are a set of recommendations around the Azure VM disk caching settings and the use of the Azure VM WriteAccelerator.
These features should be applied to the SAP HANA database data volume and log volume disks to ensure optimum performance of the database I/O operations.
This post is not about the cache settings, but about how it’s possible to gather the required information about the current settings across your landscape.
There are 3 main methods available to an infrastructure person, to see the current Azure VM disk cache settings:
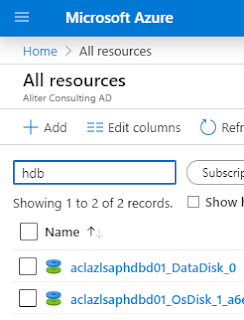
1, Using the Azure Portal to locate the VM you are interested in, then checking the disks, and looking on each disk.
You can only see the disk cache settings under the VM view inside the Azure Portal.
These features should be applied to the SAP HANA database data volume and log volume disks to ensure optimum performance of the database I/O operations.
This post is not about the cache settings, but about how it’s possible to gather the required information about the current settings across your landscape.
There are 3 main methods available to an infrastructure person, to see the current Azure VM disk cache settings:
1, Using the Azure Portal to locate the VM you are interested in, then checking the disks, and looking on each disk.
You can only see the disk cache settings under the VM view inside the Azure Portal.
While slightly counter intuitive (you would expect to see the same under the "Disks" view), it's because the disk cache feature is provided for by the VM onto which the disks are bound, therefore it's tied to the VM view.
![]()
2, Using the Azure CLI (bash or powershell) to find the disks and get the settings.
This is by far the most common approach for anyone managing a large estate. It uses the existing Azure API layers and the Azure CLI to query your Azure subscription, return the data in JSON format and parse it.
The actual query is written in JMESPATH (http://jmespath.org/) and is similar to XPath (for XML).
A couple of sample queries in BASH (my favourite shell):
List all VM names:
![]()
Then paste in the query and hit return:
![]()
3, This option is the most obscure.
Since SAP require you to have the “Enhanced Monitoring for Linux” (OEM) agent extension installed, you can obtain the disk details directly on each VM.
For Linux VMs, the OEM creates a special text file for performance counters, which is used by the Saposcol (remember that) for use by SAP diagnostic agents, ABAP stacks and other tools.
Using a simple piece of awk scripting, we can pull out the disk cache settings from the file like so:
![]()
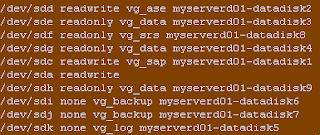
There’s a lot more information in the text file (/var/lib/AzureEnhancedMonitor/PerfCounters) and in another future post I will show how you can pull out the complete mapping between Linux disk devices, disk volume groups, Azure disk names and the disk caching settings, like so:
![]()
Useful links:
https://docs.microsoft.com/en-us/cli/azure/?view=azure-cli-latest
https://azurecitadel.com/prereqs/cli/cli-4-bash/
https://azurecitadel.com/prereqs/cli/cli-3-jmespath/
2, Using the Azure CLI (bash or powershell) to find the disks and get the settings.
This is by far the most common approach for anyone managing a large estate. It uses the existing Azure API layers and the Azure CLI to query your Azure subscription, return the data in JSON format and parse it.
The actual query is written in JMESPATH (http://jmespath.org/) and is similar to XPath (for XML).
A couple of sample queries in BASH (my favourite shell):
List all VM names:
az vm list --query [].name -o table
List VM names, powerstate, vmsize, O/S and RG:az vm list --show-details --query '[].{name:name, state:powerState, OS:storageProfile.osDisk.osType, Type:hardwareProfile.vmSize, rg:resourceGroup, diskName:storageProfile.dataDisks.name, diskLUN:storageProfile.dataDisks.lun, diskCaching:storageProfile.dataDisks.caching, diskSizeG:storageProfile.dataDisks.diskSizeGb, WAEnabled:storageProfile.dataDisks.writeAcceleratorEnabled }' -o table
List all VMs with names ending d01 or d02 or d03, then pull out the data disk details and whether the WriteAccelerator is enabled:az vm list --query "[?ends_with(name,'d01')||ends_with(name,'d02')||ends_with(name,'d03')]|[].storageProfile.dataDisks[].[lun,name,caching,diskSizeGb,writeAcceleratorEnabled]" -o tsv
To execute the above, simply launch the Cloud Shell and select “Bash” in the Azure Portal:
Then paste in the query and hit return:

3, This option is the most obscure.
Since SAP require you to have the “Enhanced Monitoring for Linux” (OEM) agent extension installed, you can obtain the disk details directly on each VM.
For Linux VMs, the OEM creates a special text file for performance counters, which is used by the Saposcol (remember that) for use by SAP diagnostic agents, ABAP stacks and other tools.
Using a simple piece of awk scripting, we can pull out the disk cache settings from the file like so:
awk -F';''/;disk;Caching;/ { sub(/\/dev\//,"",$4); printf "/dev/%s %s\n", tolower($4), tolower($6) }' /var/lib/AzureEnhancedMonitor/PerfCounters
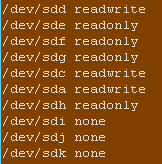
There’s a lot more information in the text file (/var/lib/AzureEnhancedMonitor/PerfCounters) and in another future post I will show how you can pull out the complete mapping between Linux disk devices, disk volume groups, Azure disk names and the disk caching settings, like so:
Useful links:
https://docs.microsoft.com/en-us/cli/azure/?view=azure-cli-latest
https://azurecitadel.com/prereqs/cli/cli-4-bash/
https://azurecitadel.com/prereqs/cli/cli-3-jmespath/