Scenario: You would like to trace a HTTP connection to a Netweaver 7.31 Java stack.
Prior to NW 7.31 you would have enabled tracing in either the old Java Administrative Tool, or newer Netweaver Administrator by setting the "enable" flag for tracing parameters of the HTTPProvider dispatcher service (see my previous blog article here).
Since Netweaver 7.31, the Java stack now includes an ICM (Internet Communication Manager) which is the main access point to which HTTP communications are routed to the Java server nodes.
Therefore, tracing in NW 7.31 Java is actually more like the ABAP stack tracing, because you simply increase the trace level in the ICM and then check the dev_icm trace file.
So the next question is, how do you access the ICM to increase the trace level in a Java stack?
Well this can be performed with the help of the SAPMC (only one "M" and not to be confused with SAP MMC for Windows).
The SAPMC was introduced in later NW 7.0 patches and is part of the sapstartsrv service.
The sapstartsrv actually listens on TCP port 5<##>13. So if you have access through your firewall, navigate to http://<app server>:5<##>13 and the the Java based applet will start up (note that you'll need Java 1.4 or above on your PC).
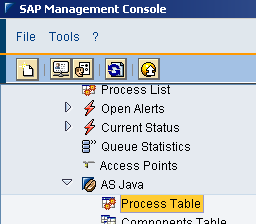
Once loaded, you can see the SAP MC and expand the "AS Java" branch to locate the "Process Table" item:
![SAP MC management console SAP MC management console]()
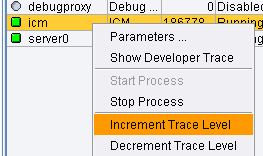
From the "Process Table" you should be able to right click the ICM (on the right) and increment the trace level:
![SAP MC increase ICM trace level SAP MC increase ICM trace level]()
The trace level is dynamically increased.
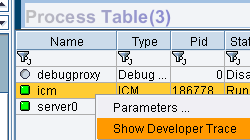
To see the trace file, right click again and select "Show Developer Trace":
![SAP MC ICM display trace SAP MC ICM display trace]()
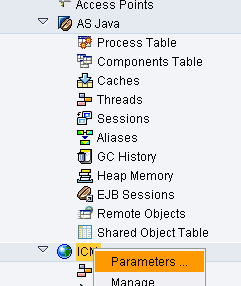
You can always see the current trace level by right clicking the ICM and selecting "Parameters...", or actually right clicking the ICM node further up the tree and selecting "Parameters...":
![SAP MC show ICM parameters SAP MC show ICM parameters]()
The current trace level is shown as the "rdisp/TRACE" parameter value on the Dispatcher tab:
![SAP MC rdisp/TRACE ICM SAP MC rdisp/TRACE ICM]()
Again, right clicking the actual ICM node in the tree gives you direct access to the ICM management web page:
![MWSnap106 2014-07-23, 09_39_44 MWSnap106 2014-07-23, 09_39_44]()
From the ICM management page, you can also see the current trace level:
![ICM Manager Monitor ICM Manager Monitor]()
Good luck with your tracing.
Prior to NW 7.31 you would have enabled tracing in either the old Java Administrative Tool, or newer Netweaver Administrator by setting the "enable" flag for tracing parameters of the HTTPProvider dispatcher service (see my previous blog article here).
Since Netweaver 7.31, the Java stack now includes an ICM (Internet Communication Manager) which is the main access point to which HTTP communications are routed to the Java server nodes.
Therefore, tracing in NW 7.31 Java is actually more like the ABAP stack tracing, because you simply increase the trace level in the ICM and then check the dev_icm trace file.
So the next question is, how do you access the ICM to increase the trace level in a Java stack?
Well this can be performed with the help of the SAPMC (only one "M" and not to be confused with SAP MMC for Windows).
The SAPMC was introduced in later NW 7.0 patches and is part of the sapstartsrv service.
The sapstartsrv actually listens on TCP port 5<##>13. So if you have access through your firewall, navigate to http://<app server>:5<##>13 and the the Java based applet will start up (note that you'll need Java 1.4 or above on your PC).
Once loaded, you can see the SAP MC and expand the "AS Java" branch to locate the "Process Table" item:

From the "Process Table" you should be able to right click the ICM (on the right) and increment the trace level:

The trace level is dynamically increased.
To see the trace file, right click again and select "Show Developer Trace":

You can always see the current trace level by right clicking the ICM and selecting "Parameters...", or actually right clicking the ICM node further up the tree and selecting "Parameters...":

The current trace level is shown as the "rdisp/TRACE" parameter value on the Dispatcher tab:

Again, right clicking the actual ICM node in the tree gives you direct access to the ICM management web page:

From the ICM management page, you can also see the current trace level:

Good luck with your tracing.